Subject


Figure 1. Reported use of different digital PCR platforms over time in published articles from November 2011 until March 2016. The absolute numbers (a, c) and ratios in percentage (b, d) are depicted for ddPCR vs non-ddPCR usage in a general dPCR context

Figure 1. Total number of newly diagnosed HIV/AIDS cases and number of deaths per calendar year in the period 2005–2014 in the WHO region of Central Europe in the period 2005–2014 (ECDC data)

Figure 2. Rate of new diagnoses per 100,000 population by country and year of diagnosis in Central Europe (ECDC data)

Figure 3. Male-to-female ratio by country and year of diagnosis in the WHO region of Central Europe in the period 2005–2014 (ECDC data)

Figure 4. New HIV diagnoses by age group and year of diagnosis in the WHO region of Central Europe in the period 2005–2014 (ECDC data)

Figure 1. Association between quantity of CMV found in the urine and the severity of disease in neonates. Redrawn from Stagno et al. J Infect Dis 1975; 132: 568–577

Figure 2. Detection of CMV DNA by real time PCR post-transplant is distinct among four subgroups of patients defined by their donor and recipient serostatus pre-transplant. Redrawn from Atabani et al. [14]

Figure 1. Namiba et al. Journal of Virus Eradication 2016; 2: 110–111
Figure 1. Pollack et al. Journal of Virus Eradication 2016; 2: 102–106

Figure 1. Hagen and Altfeld. Journal of Virus Eradication 2016; 2: 78–81

Figure 1. Wansom et al. Journal of Virus Eradication 2; 2: 87–93

Figure 1. Phanuphak and Phanuphak. Journal of Virus Eradication 2016; 2: 107–109

Figure 2. Phanuphak and Phanuphak. Journal of Virus Eradication 2016; 2: 107–109

Figure 1. Johnston et al. Journal of Virus Eradication 2016; 2: 117–120

Figure 2. Johnston et al. Journal of Virus Eradication 2016; 2: 117–120

Figure 3. Johnston et al. Journal of Virus Eradication 2016; 2: 117–120
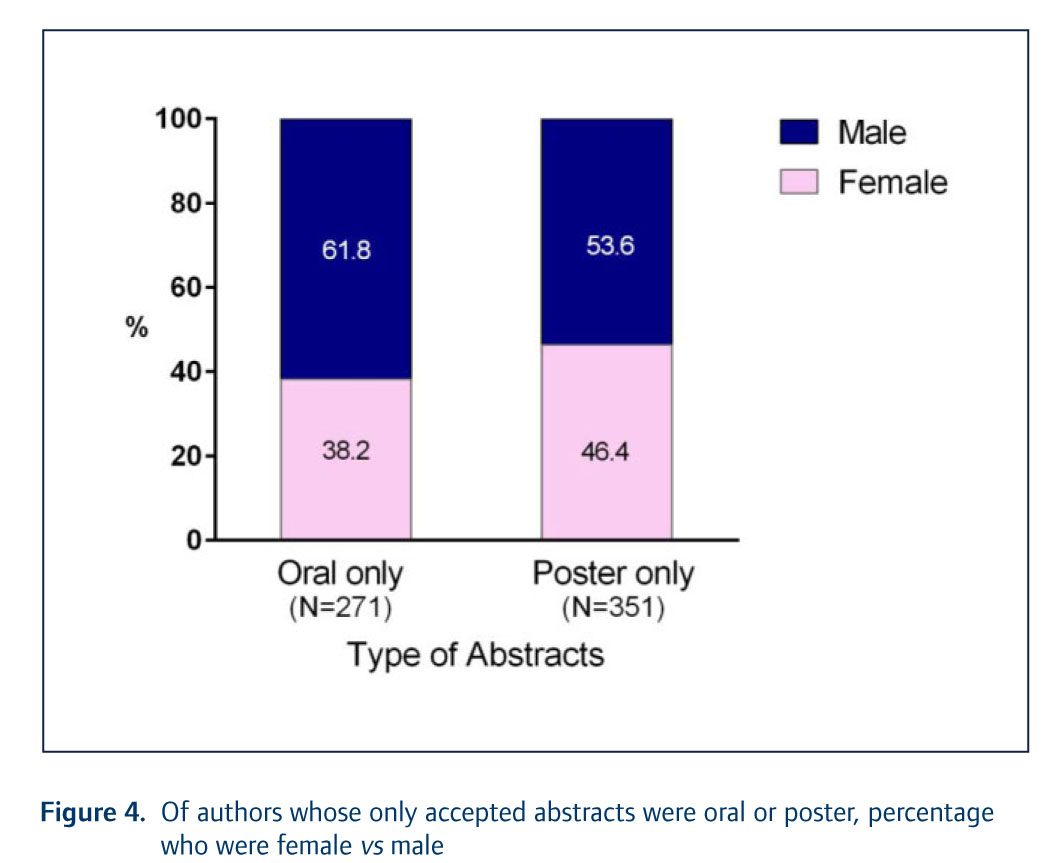
Figure 4. Johnston et al. Journal of Virus Eradication 2016; 2: 117–120

Figure 4. Johnston et al. Journal of Virus Eradication 2016; 2: 117–120
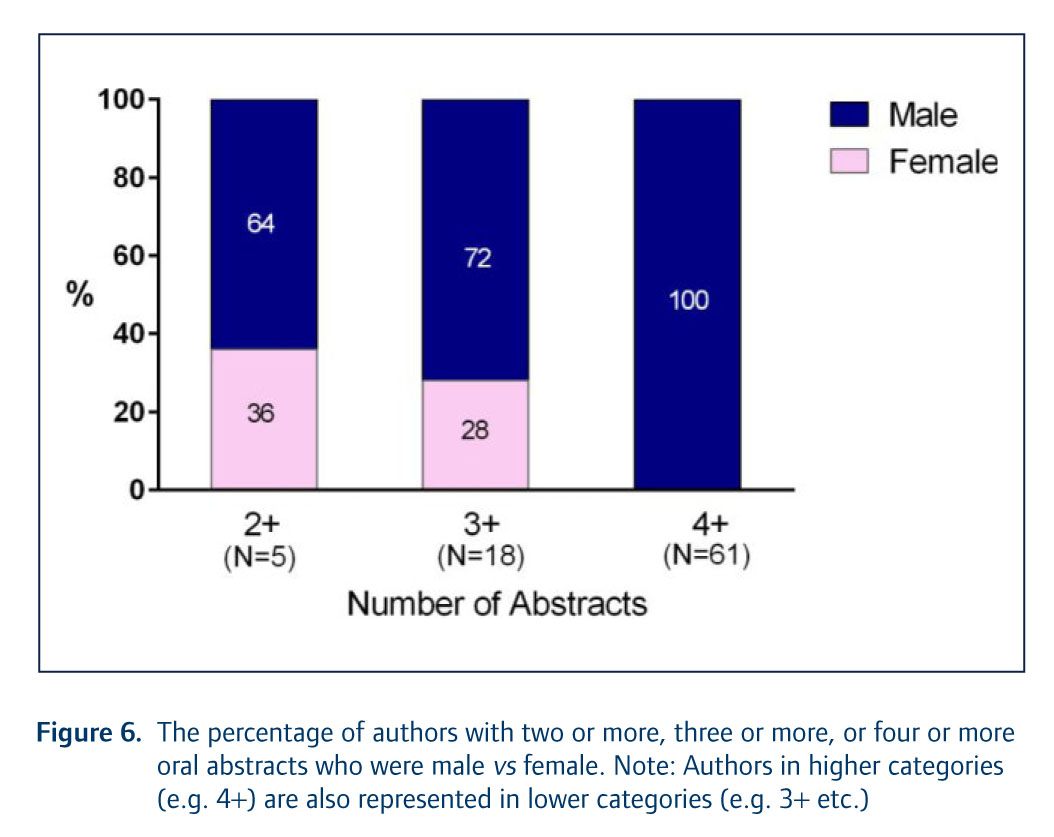
Figure 6. Johnston et al. Journal of Virus Eradication 2016; 2: 117–120

Ananworanich et al. Journal of Virus Eradication 2015; 1: 196–202. Figure 1

Ananworanich et al. Journal of Virus Eradication 2015; 1: 196–202. Figure 2

Martinez-Bonet et al. Journal of Virus Eradication 2015; 1: 148–152. Figure 1

Bunupuradah et al. Journal of Virus Eradication 2015; 1: 185–191. Figure 1

Turkova et al. Journal of Virus Eradication 2015; 1: 179–184. Figure 1

Foster et al. Journal of Virus Eradication 2015; 1: 173–178. Figure 1

Palma et al. Journal of Virus Eradication 2015; 1: 134–139. Figure 4

Palma et al. Journal of Virus Eradication 2015; 1: 134–139. Figure 5

Palma et al. Journal of Virus Eradication 2015; 1: 134–139. Figure 1

Palma et al. Journal of Virus Eradication 2015; 1: 134–139. Figure 2

Palma et al. Journal of Virus Eradication 2015; 1: 134–139. Figure 3

Ananworanich et al. Journal of Virus Eradication 2016; 2: 43–48. Figure 1

Ananworanich et al. Journal of Virus Eradication 2016; 2: 43–48. Figure 2

Kusic. Journal of Virus Eradication 2016; 2: 32–35. Figure 1

Kusic. Journal of Virus Eradication 2016; 2: 32–35. Figure 2

Kusic. Journal of Virus Eradication 2016; 2: 32–35. Figure 3

Rangarajan. Journal of Virus Eradication 2016; 2: 36–42. Figure 1

Modjarrad. Journal of Virus Eradication 2016; 2: 1–4.

Ruxrungtham. Journal of Virus Eradication 2016; 2: 12–18. Figure 1

Ruxrungtham. Journal of Virus Eradication 2016; 2: 12–18. Figure 2

Ruxrungtham. Journal of Virus Eradication 2016; 2: 12–18. Figure 3

Ruxrungtham. Journal of Virus Eradication 2016; 2: 12–18. Figure 4

Ruxrungtham. Journal of Virus Eradication 2016; 2: 12–18. Figure 5

Ruxrungtham. Journal of Virus Eradication 2016; 2: 12–18. Figure 6

Ruxrungtham. Journal of Virus Eradication 2016; 2: 12–18. Figure 7

Hill. Journal of Virus Eradication 2016; 2: 28–31. Figure 1

Hill. Journal of Virus Eradication 2016; 2: 28–31. Figure 2

Hill. Journal of Virus Eradication 2016; 2: 28–31. Figure 3

Hill. Journal of Virus Eradication 2016; 2: 28–31. Figure 4

Hill. Journal of Virus Eradication 2016; 2: 28–31. Figure 5

Hill. Journal of Virus Eradication 2016; 2: 28–31. Figure 6
Rokx et al. Journal of Virus Eradication 2015; 1: 211–220. Figure 1
Rokx et al. Journal of Virus Eradication 2015; 1: 211–220. Figure 2
Rokx et al. Journal of Virus Eradication 2015; 1: 211–220. Figure 3
Rokx et al. Journal of Virus Eradication 2015; 1: 211–220. Figure 4
Rokx et al. Journal of Virus Eradication 2015; 1: 211–220. Figure 4A
Hurst & Buss Journal of Virus Eradication 2015; 1: 208–210. Figure 1
Wittawatmongkol et al. Journal of Virus Eradication 2015; 1: 192–195. Figure 1

Sudjaritruk & Puthanakit. Journal of Virus Eradication 2015; 1: 159–167. Figure 2

Sudjaritruk & Puthanakit. Journal of Virus Eradication 2015; 1: 159–167. Figure 1
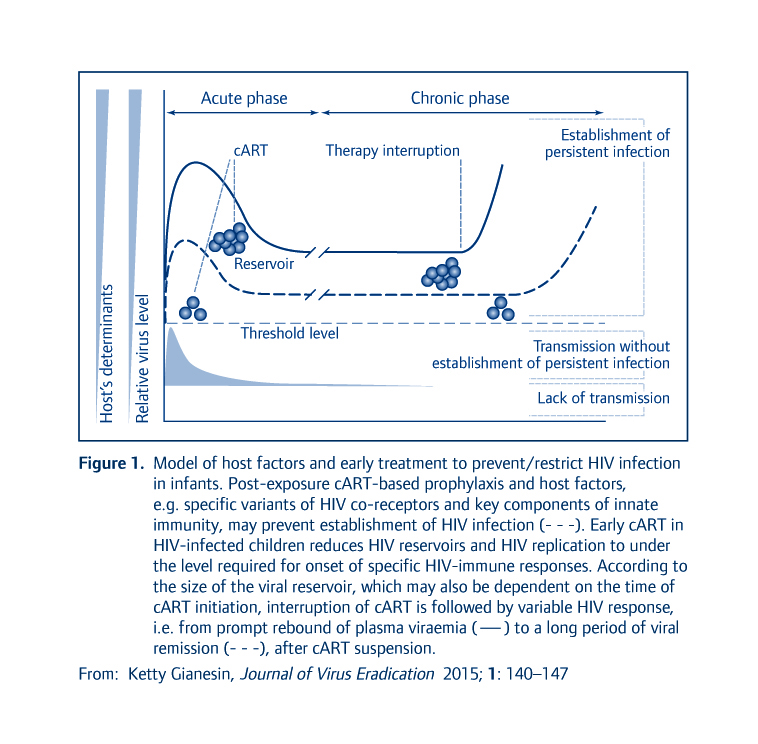
Gianesin et al. Journal of Virus Eradication 2015; 1: 140–147. Figure 1

Gianesin et al. Journal of Virus Eradication 2015; 1: 140–147. Figure 2
Cotugno et al. Journal of Virus Eradication 2015; 1: 153–158. Figure 1
Cotugno et al. Journal of Virus Eradication 2015; 1: 153–158. Figure 2
Cotugno et al. Journal of Virus Eradication 2015; 1: 153–158. Figure 3

Hill et al. Journal of Virus Eradication 2015; 1: 257–263. Figure 1

Hill et al. Journal of Virus Eradication 2015; 1: 257–263. Figure 2a,b

Hill et al. Journal of Virus Eradication 2015; 1: 257–263. Figure 2 c,d
Gega et al. Journal of Virus Eradication 2015; 1: 264–268. Figure 1

Maldarelli. Journal of Virus Eradication 2015; 1: 237–244. Figure 1

Maldarelli. Journal of Virus Eradication 2015; 1: 237–244. Figure 2

Maldarelli. Journal of Virus Eradication 2015; 1: 237–244. Figure 3
Figure 1. Milestones in the treatment of HCV genotype 1 infection.
Figure 1. Final diagnostic category in patients aged >60 years from consecutive patients presenting to the Jaundice Hotline Clinic.
Figure 2. Final diagnoses in 1054 consecutive patients with jaundice/hepatitis presenting in the Jaundice Hotline Clinic 1998–2014, showing that 5% are caused by HEV genotype 3.
Figure 3. Treatment algorithm for chronic HEV infection in the transplant population.
Figure 4. The clinical spectrum of infection with HEV genotype 3. Most cases are asymptomatic; however, many are symptomatic, but not recognised.
Figure 1. Distribution of outcome and resource attitudes about participation in HIV cure-related trials.
Figure 3. The lowest price for entecavir 0.5 mg in selected countries (per patient per year).
Figure 2. Assumptions and calculation of generic entecavir target price.
Figure 1. The chemical structures of (a) abacavir and (b) entecavir.
Figure 1. Study screening and accrual. *Three megaHAART patients missed their week 96 visit
Figure1. HPV genotype prevalence among 40 perinatally HIV-infected adolescents.
Figure 4. Changes in numbers of MSM clients at the Thai Red Cross AIDS Research Centre during implementation of the Adam’s Love communications strategy.
Figure 3. Top questions by MSM on Adam’s Love online HIV counselling and support platforms.
Figure 2. Devices used by MSM for accessing Adam’s Love website and social media networks.
Figure 1. Adam’s Love website and social network engagement metrics analysed as of January 2015.
Back to top